UBC astronomers help unveil Jupiter's smallest known moon
 In a paper published by the Astronomical Journal, a team of astronomers (including 2 PHAS members – Dr. Brett Gladman and PhD student Mike Alexandersen) report the discovery of the smallest two moons orbiting around Jupiter. Based on their brightness, the sizes of the moons are estimated: S/2010 J 1 is estimated to be ~3km in diameter, while S/2010 J2 is estimated to be just ~2km in diameter. "It was exciting to realise that this [S/2010 J 2] is the smallest moon in the Solar System that was discovered and tracked from Earth," said Alexandersen. "We had actually already reported measurements of the first moon from Feb. 27 and 28, 2003 to the Minor Planet Center eight years ago", said Gladman, "but observations over several months are required to prove that the object is orbiting Jupiter, and this moon was too faint for the 2003 surveys to consistently track."
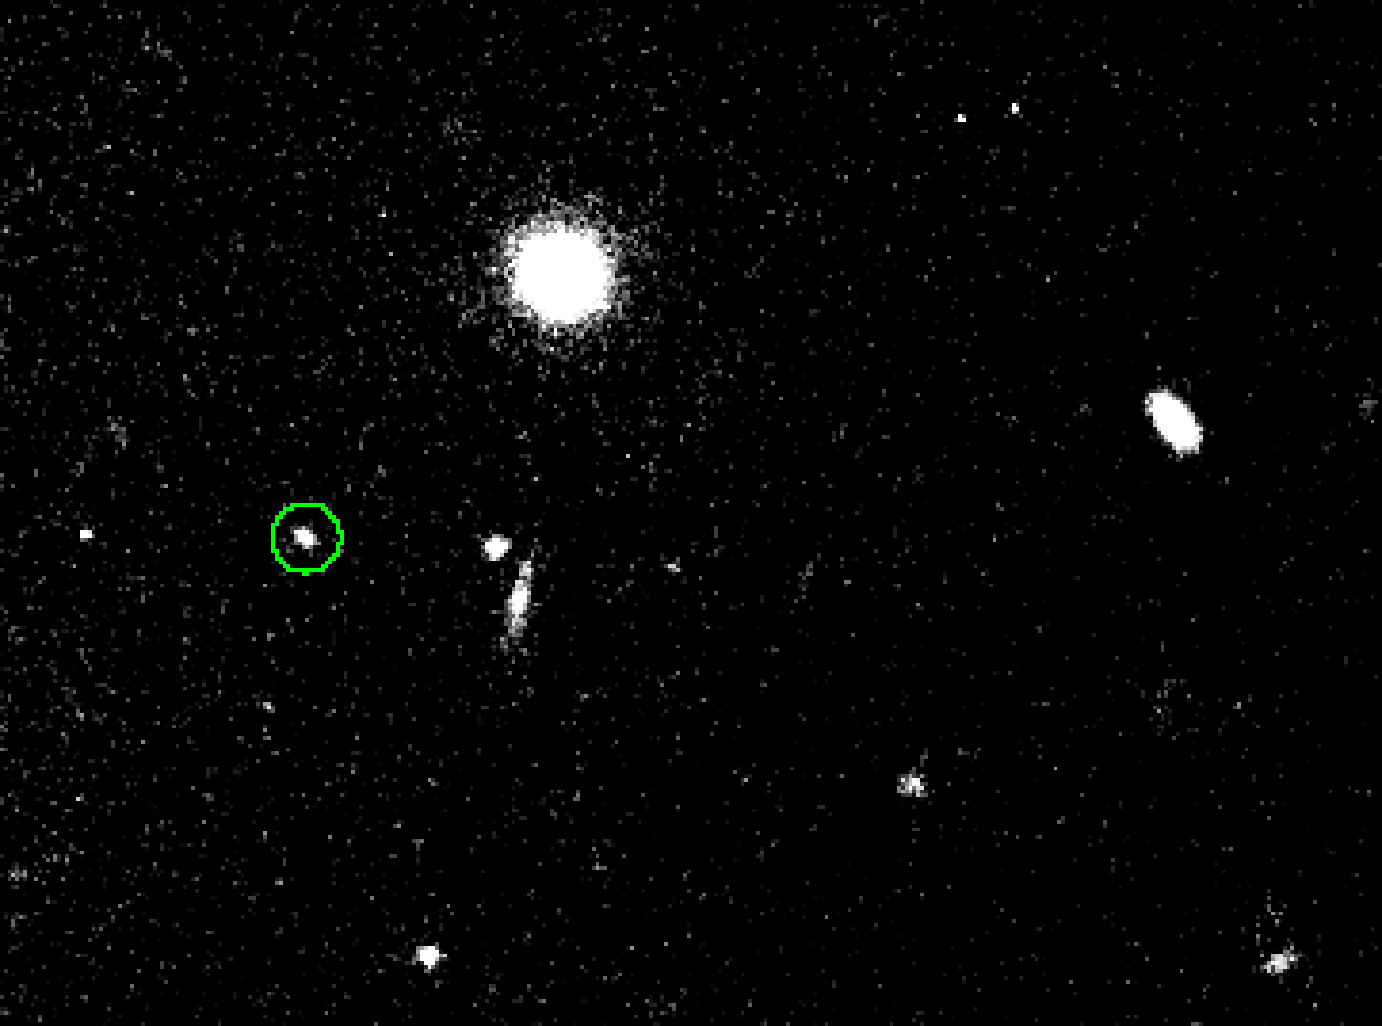
This discovery brings the total number of known satellites for Jupiter to 67. S/2010 J 1 was discovered on images taken at the Palomar 200 inch Hale Telescope on the 7th and 8th of September 2010, by an international team (NASA Jet Propulsion Laboratory (JPL) astronomers Robert Jacobson and Marina Brozovic, and University of British Columbia astronomy professor Brett Gladman and Ph.D. student Mike Alexandersen). S/2010 J 2 was discovered on the 8th of September 2010 on images taken with the MegaCam mosaic CCD camera at the 3.6m Canada-France-Hawaii telescope (CFHT) by CFHT executive director and collaborator Christian Veillet. Upon later inspection, S/2010 J 2 was also weakly visible in the September 7th images from Palomar.
For more information visit the following pages:
- Astronomical Journal Publication: Discovery of Two Additional Jovian Irregulars
- Mike Alexandersen’s PHAS web page
- Original press release
- Animation of S/2010 J 1 using CFHT images from the 8th of September 2010, sped up by a factor of 2000. The actual time between each image in the animation is roughly 38 minutes. (.gif)
- Offset plot of S/2010 J 1 and S/2010 J 2 in 2010 to 2011. Red diamonds show the observed locations of S/2010 J 1 in our 2010-2011 observations, while blue triangles show the locations of S/2010 J 2. The predicted positions of the satellites for the best fit orbits from JPL are plotted at 48-hour intervals, shown by the red and blue dots for S/2010 J 1 and S/2010 J 2, respectively. The ephemerides are plotted for the two-year period 2010-Mar-01 to 2012-Mar-01, similar to the orbital period of the moons. The dashed circle of radius 0.5 degrees centred on Jupiter is for reference, and to illustrate the area within which it is difficult to track satellites due to scattered light from Jupiter. (.png)
- Offset plot of all S/2010 J 1 observations from 2003 to 2011. In this plot, and in the plot above, the orbits look chaotic and as if they do not close back on them selves in nice eliptical orbits as they should be. This is a projection effect, caused by the fact that this is the position AS SEEN FROM EARTH, while both the Earth and Jupiter moves through space, so we are constantly viewing it from the different angles. If we were to view the orbits from a fixed angle at a fixed distance, they would appear as closed elipses. (.png)